Striking the League vs. Team Profitability Balance in the NHL

The NHL is a consortium of individual teams. Each franchise operates with their own ownership and P&L. Thus each franchise tries to maximize their economic return individually, while working in association with the rest of the league as it relates to the players union and other league-wide agreements.

The following graphic shows the core of the fundamental issue between the NHLPA and the NHL. While the league overall makes about $126M and 4.1% operating income which is okay, but not great compared to where they could/should be. However, at the team level, it is nowhere nearly as pretty a picture. As you can see, over two-thirds of the teams are struggling to turn a profit.

Source: Forbes

At the NHL Players Association, it makes sense for them to take a position which puts the onus of finding a solution to this imbalance on the owners and suggest they find new revenue sharing levers amongst themselves. This is why the NHLPA’s counter-proposal had some merit. It suggested that the overall league would become more profitable by allowing revenue growth to outpace player salary growth, thus increasing league-wide margin. As well, they proposed several ideas about how to allow for teams to shift revenue from profitable to unprofitable teams using performance-related financial instruments.

On the other side, from the league and owners perspective, they are trying to make each franchise successful and profitable on their own merits – while maintaining competitive balance with a hard salary cap.

So who is right?  Where should the line be drawn for overall league profitability (which it is now) and having the majority of teams being profitable (which they are not)?  Removing salary cap restrictions could allow each team to operate profitably, but would remove competitive balance – this option would be more like Major League Baseball and is in line with the NHLPA’s proposals. But the NHL wants all three: league profitability, team profitability AND competitive balance. In order for the NHL and NHLPA to come to an agreement they will need to find a compromise on where this balance is struck.

What would healthy economics look like for a typical NHL team?

Now that we have looked at the overall league economics and the two ends of the financial spectrum between the Top 5 and Bottom 5 revenue teams, we really need to focus on the teams in the middle.

In portfolio management there are always ‘stars’ and ‘dogs’ but it is the fat middle of teams that really matter.  In fact, if you follow the GE/Jack Welch’s low-producing team mantra, the bottom teams are problems that need to be fixed by ownership/management and are not really an issue for the players to solve.

So now, let’s focus on the teams that represent the core of the National Hockey League, the 20 teams in the fat middle. We will refer to them as the “Middle 20”. If the “Middle 20” are not financially healthy given the economic business model that should be associated with a sports league like the NHL, then it makes sense to question the cost structure of the league.

As you can see, even though the salary cap is set at 57% across the entire league, for the ”Middle 20” teams are paying 63% of revenues in salary.  And with operating costs estimated to be $37.5 M by our analysis, the average “Middle 20” team is at best breaking even and more likely than not losing money.

So what should the cost structure look like?

Once again we will ignore the Top 5 and Bottom 5 teams and focus on the “Middle 20”. As discussed previously, it should not be unreasonable for these “Middle 20” teams to earn 8-12% operating income. Therefore, a sustainable cost structure could look like this (note this uses 2012 numbers and does not adjust for projected growth in 2012-13):

2011-12 “Middle 20” Economics to get to 8-12% Margins


We are not recommending any specific numbers, just showing a range on how the numbers could work to get to the 8-12% range.  If you take the median salary revenue share number of 51% for the “Middle 20” that would make a $49M salary cap hit for these teams. Currently the Top 5 teams spend ~8% more than the “Middle 20”. Assuming the top teams are at the salary cap ceiling, this would make the ceiling at $53M.  If you then extrapolate across the league, where you have 30 teams with an average salary cap hit of about $50M you get an effective revenue share rate of about 48.4%.  This overall number appears to be somewhat similar to the owners first proposal and may follow some of their rationale. Either way, it is clear the current 57% rate does not appear to be a reasonable rate.

As with any business, ownership must look across all economic levers (both costs and revenue) to improve profitability, so cost savings can clearly be found both in salaries and operating costs. Given that most of these costs are variable in the shorter term it is not unreasonable for  each cost center to contribute to finding some savings so that the burden is shared across all parties.


NHL Team by Team Economics

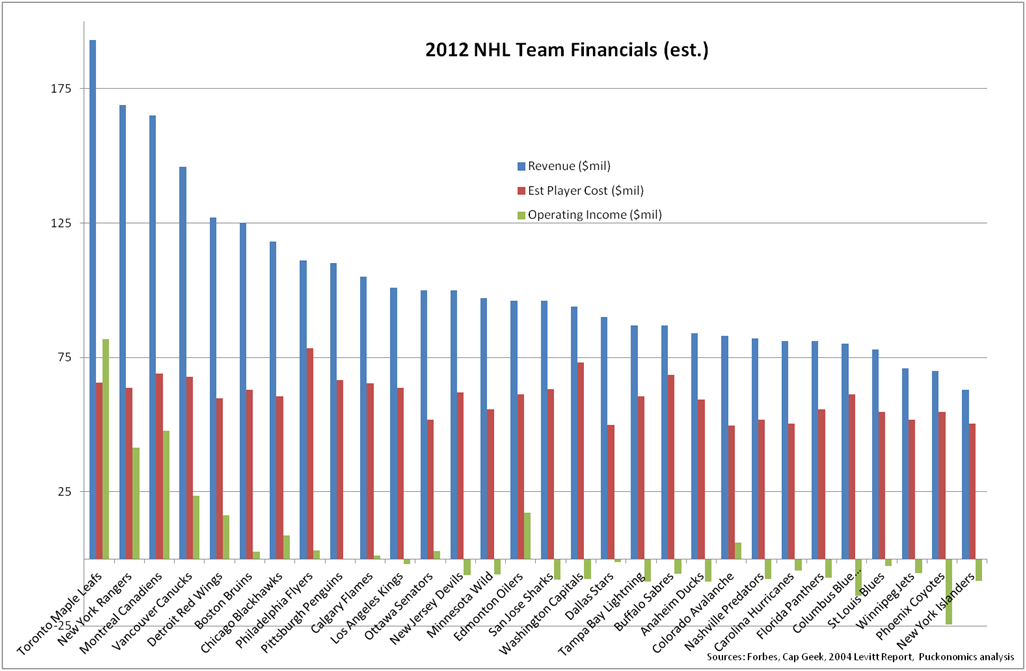
Now that we have looked at the general economics of the NHL as an entertainment /sports league compared to similarly structured industries, it is important to review the economics of individual teams (aka markets). Not all teams are created equal in the NHL portfolio and as a results there will always be ‘stars’ and ‘dogs’ and everything in between.

While the following data may or may not be exactly right, the over numbers do add up and certainly provide an excellent framing of the issues that are being discussed about big market vs.  small market teams. The following data is from ForbesCap Geek, our own analysis and leverages some additional operating cost details from the 2004 Levitt Report (adjusted for 2012 numbers).


Clearly there is a massive different between the Top 5 revenue teams are the Bottom 5 by basically a factor of more than 2:1 in aggregate.  This disproportionate sizing significantly affects smaller revenue teams since the salary cap is a factor of overall league revenues, so in effect as the big markets grow, the smaller markets must disproportionately spend a greater percent of their revenues on player salary just to remain competitive. The following table compares big difference in player salary as a percent or revenue at the two ends of the spectrum:

So what does this mean?  Large revenue teams have huge margins, but small revenue teams are going to struggle to break even because their operating costs need to be less than 33% of costs.

Based on our analysis and extrapolating data from the Levitt report, we estimate the average operating costs for a team is about $38.5M per year (and of course varies by team/market).  But at roughly those fixed costs, it is nearly impossible for small revenue teams to breakeven without changes to their cost structure.

This might be obvious to many people, but seeing the actual numbers and how many teams are affected by the overall average salary cap because of the disproportionate size of the Top 5 teams makes it a little more concrete how big the issue is.

1/3rd of NHL Players receive 2/3rds of total salary

As the collective bargaining agreement discussions began today, it was interesting to think about where the power lies within the NHLPA.  As we have seen in our analyisis, veteran / UFA players appear to receive disproportionate compensation relative to their performance when compared to entry level and restricted free agent player output. Basically on a pay-for-performance basis, younger players are subsidizing older players based on seniority.  That being said, we saw how the latest NFL CBA strongly favor veteran, multi-year players over less experienced players.

So we decided to see what the distibution of salaries looks like in the NHL and examine how much power the elite players might yield based on their compensation.  Here are the results of our analyis of the top 752 players who played in the NHL in 2011-12.


2011-12  Distribution of Player Salaries (Cap Hit)

Salary   Level $5M or more $4M – $5M $3M-$4M $2M-$3M $1M-$2M <$1M Total
# of Players 78 61 103 85 152 272 751
% of Players 10% 8% 14% 11% 20% 36%
Total $ (M) $486 $262 $352 $211 $212 $171 $1,693
% of Ttl $ 29% 15% 21% 12% 13% 10%

As you can, about 65% of all the salaries go to about 32% of players who make more than $3M per year. This is not surprising, and somewhat less disproportionate than one might have expected.

Note: This analysis is consistent with the Puckonomics methodology and does not include every single player who played in the NHL in 2011-12 or who got paid despite not playing.

2011-12 Most Valuable Rookies

In anticipation of the NHL Awards being given out tonight, and in particular the Calder Trophy for the best rookie of the 2011-12 campaign. Here is our analysis on who contributed to most value this past year of the three finalists up for the award.

Team GP Goals Assists Points True Value ($M) Cap Hit ($M) Difference ($M)
1. Gabriel Landeskog COL 82 22 30 52 3.85 3.58 0.28
2. Adam Henrique NJD 74 16 35 51 3.69 0.81 2.89
3. Ryan Nugent-Hopkins EDM 62 18 34 52 3.60 3.78 -0.17

Clearly there was not much different in the True Value of the finalists, but if RNH played the entire without injury he likely would have easily won the award.  However based on our analysis, Gabriel Landeskog was the most valuable rookie in 2011-12 especially when seeing that he had a +20 plus/minus.   We shall see how the voting turned out later tonight.

2011-12 Most Overpaid Forwards

Similar to defensemen, a couple of the most overpaid forwards did not play a full season.  The exception is Alex Ovechkin who played the full season (except for his suspension) but is clearly paid for more than just his performance on the ice. He is one of few players who puts butts in the seat and eyeballs in front of the television.

We discussed Scott Gomez’s contract previously, but in 2011-12 injuries did play a partial role in how much he was overpaid by only playing in  38 games, but it is likely he still would have been on our list.

Team GP Goals Assists Points True Value ($M) Cap Hit ($M) Difference ($M)
1. Scott Gomez MTL 38 2 9 11 0.94 7.36 -6.42
2. Chuck Kobasew COL 58 7 7 14 1.20 6.75 -5.55
3. Alex Ovechkin WSH 78 38 27 65 4.61 9.02 -4.42

Sidney Crosby and Kristian Huselius would have been on this list but both missed many games in 2011-12. In particular, Crosby’s numbers in just 22 games were essentially on pace for his $8.7M cap hit.

2011-12 Most Overpaid Defensemen

This year’s list of most overpaid defensement based on the True Value they provided to their teams had two things in common. All had injuries during the season which kept them out of a significant number of games. Also, on top of not playing many games, they also did not perform at a level commiserate with their contract, so that even if their stats were extrapolated to a full season they would still have grossly underperformed relative to their cap hit. A third coincindence is that all three were named Michael.

Team GP Goals Assists Points TOI True Value ($M) Cap Hit ($M) Difference ($M)
1. Mike Green WSH 32 3 4 7 21.03 1.11 5.11 -3.99
2. Mike Komisarek TOR 45 1 4 5 16.65 1.10 4.50 -3.40
3. Michal Rozsival PHX 54 1 12 13 19.32 1.83 5.00 -3.17

Chris Pronger and Andrei Markov are not on this list since both players played less than 15 games in 2011-12, otherwise they would be nat or near the top of this list.

2011-12 Most Valuable Forwards

For the forwards the Top 3 most valuable players were not much of a surprise. They were hands down the top forwards in the league last year over the course of 82 games.


Team GP Goals Assists Points True Value ($M) Cap Hit ($M) Difference ($M)
1. Evgeni Malkin PIT 75 50 59 109 7.13 8.70 -1.57
2. Steven Stamkos TBL 82 60 37 97 6.58 7.50 -0.92
3. Claude Giroux PHI 77 28 65 93 6.27 3.75 2.52

The only question may be about Ilya Kovalchuck, but at 83 points we a tier below the top 3.

2011-12 Most Valuable Defensemen

Well, the top three most valuable defensement are not really that difficult to explain other than Shea Webber not appearing on the list.

Team GP Goals Assists Points TOI True Value ($M) Cap Hit ($M) Difference ($M)
1. Erik Karlsson OTT 81 19 59 78 25.32 6.24 1.30 4.94
2. Brian Campbell FLA 82 4 49 53 26.88 5.16 7.14 -1.98
3. Zdeno Chara BOS 79 12 40 52 25.00 4.85 6.92 -2.07

Once again it is important to keep in mind a couple of things, this analysis looks at who added the most value over 82 games, not the ‘best’ player.  Shea Webber was just marginally left out of the top 3, but it is likely if he played the 82 games instead of 79 he would be on this list.  Net-net, given the profilic offensive performance of Erik Karlsson, it would be a surprise if he didn’t win the Norris trophy this year.

2011-12 Most Overpaid Goalies

Before we start it is important to point out that the Puckonomics methodology sees the True Value of goalies consistently being significantly lower than the actual salaries of the top goalies in the league. Essentially this means there is significant inefficiency in the goalie salary market which results in high-end goalies being disproportionally over-compensated for the value they contribute.

Now that being said there are a couple of caveats to the list below.

Team GP Wins OTL True Value ($M) Cap Hit ($M) Amt Overpaid   ($M)
1. Niklas Backstrom MIN 46 19 7 2.53 6.00 3.47
2. Henrik Lundqvist NYR 62 39 5 4.15 6.88 2.72
3. Ryan Miller BUF 61 31 7 3.66 6.25 2.59

First off, Rick Dipietro would be at the top of this list if he played in more than eight games, but since he was injured for most of the season he did not qualify for this list. We will do a separate analysis of his true value compared to his cap hit shortly.

Niklas Backstrom is at the top of the list for a similar reason, if he hadn’t gotten hurt and played in 60 or more games he likely would not have been on this list.

Lundqvist and Miller made the list due mostly to the over-compensation of high-end goalies detailed above and just partially due to number of games played.