What is fair?

When I read players and agents tweets saying that all they want is a fair deal, I always think about the first book on negotiations I read when I was kid. It basically said that fairness is entirely in the eye of the beholder. What is fair to you is not necessarily fair to me. Here are examples of what basically is being said by both sides:

  • It’s not fair to ask players to take a significant pay cut compare to what they make now
  • It’s not fair that 2/3rds of team owners lose money just to remain competitive
  • It’s not fair that players can’t make as much as what the owners are willing to pay
  • It’s not fair that owners take all the business risks such as building arenas and market development
  • It’s not fair that owners choose to sign players to large contracts and then ask for that money back
  • It’s not fair for the owners to want to change the agreement they themselves mandated in 2004

Without context, each statement seems quite reasonable, however, there is a lot more to the equation than any individual points perspective. Each of these arguments as to what is or isn’t fair can be argued either way and is basically a meaningless conversation. What matters is getting agreement on what everyone is solving for (parity vs. profitability) as opposed to who is being fair or not.

How parity, a hard salary cap and team profitability are the essence of the CBA discussions

Team owners are just as competitive as the players on the ice. They want their teams to win and will try everything they can within the rules to win the Stanley Cup.  At the same time they are business people who must balance the owners’ conundrum. So ironically, league parity is something that each team wants for all the other teams but themselves.

While not the only factor, parity in the NHL has certainly contributed to the tremendous growth of the league in the last few years.  With so many teams fighting for a playoff spot going into the final weeks and days of the season this certainly helps each contending team’s ticket sales and viewership. As a result, overall revenues have continued to grow every year.

The league is an ecosystem unto itself, where teams depend on each other’s success to drive interest and revenue.  The salary cap created a more even playing field for teams to compete for talent and stay within a reasonable band of each other.  As a result we have seen that the salary cap has worked reasonably well the last seven years to create parity.

However, the salary cap is not perfect and several teams have found creative methods to try and circumvent it. Examples include burying contracts in the AHL or Europe, buyouts and trading outsized contracts to budget teams to help them reach the cap floor.  There will always be ways to game the salary cap in which richer teams try to take advantage to gain a competitive edge. The NHL wants to close most of these elements which soften the salary cap.  Many of the NHLPA proposals such as a luxury tax, retaining traded-player salaries and trading draft picks for cash are all ways to softly loosen the salary cap and reduce parity in the league. Clearly this is in the interest of players because it is then easy to argue that lower revenue teams can now become profitable without dramatically lowering overall salaries. But once again this creates a loose salary cap and is likely to reduce overall competitiveness.

Connecting the dots…

The NHL wants the best of both worlds; overall parity and individual franchise profitability. On the other side of the coin, it is in the players’ interest to have as soft a salary cap as possible since this allows high revenue teams to find ways to spend more on players and try to gain a competitive advantage while staying within the cap rules.  The result should see more profitable teams and less of a need to reduce the share of revenue for the players at the expense of the current parity.

Once the owners and players agree upon where to draw the parity vs. team profitability line then determining the revenue share percent for players will become a much easier discussion and move both sides a lot closer to a new CBA.

Striking the League vs. Team Profitability Balance in the NHL

The NHL is a consortium of individual teams. Each franchise operates with their own ownership and P&L. Thus each franchise tries to maximize their economic return individually, while working in association with the rest of the league as it relates to the players union and other league-wide agreements.

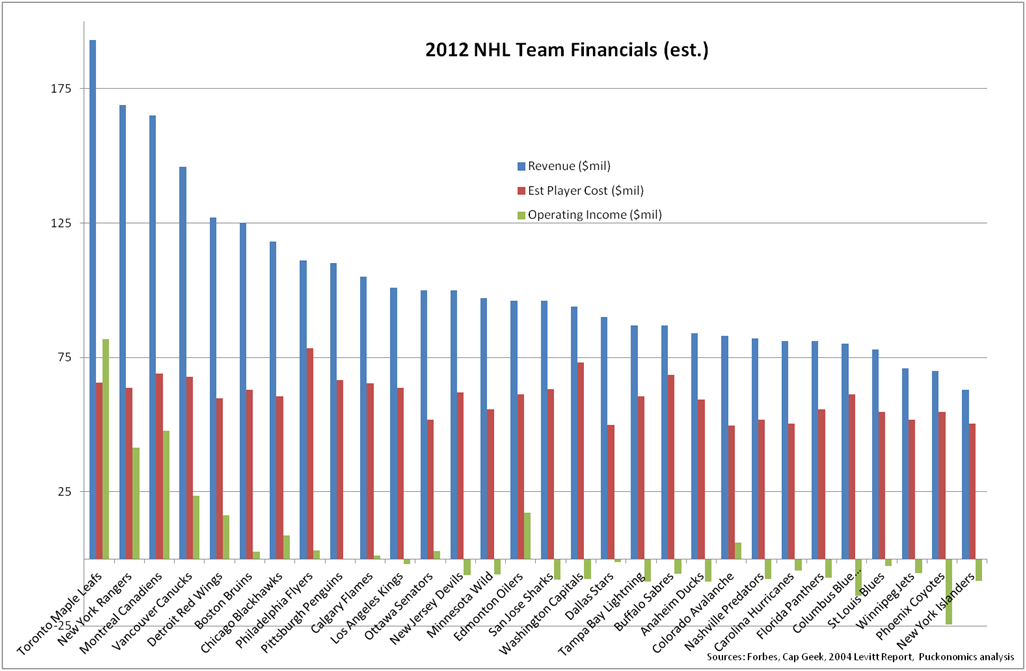
The following graphic shows the core of the fundamental issue between the NHLPA and the NHL. While the league overall makes about $126M and 4.1% operating income which is okay, but not great compared to where they could/should be. However, at the team level, it is nowhere nearly as pretty a picture. As you can see, over two-thirds of the teams are struggling to turn a profit.

Source: Forbes

At the NHL Players Association, it makes sense for them to take a position which puts the onus of finding a solution to this imbalance on the owners and suggest they find new revenue sharing levers amongst themselves. This is why the NHLPA’s counter-proposal had some merit. It suggested that the overall league would become more profitable by allowing revenue growth to outpace player salary growth, thus increasing league-wide margin. As well, they proposed several ideas about how to allow for teams to shift revenue from profitable to unprofitable teams using performance-related financial instruments.

On the other side, from the league and owners perspective, they are trying to make each franchise successful and profitable on their own merits – while maintaining competitive balance with a hard salary cap.

So who is right?  Where should the line be drawn for overall league profitability (which it is now) and having the majority of teams being profitable (which they are not)?  Removing salary cap restrictions could allow each team to operate profitably, but would remove competitive balance – this option would be more like Major League Baseball and is in line with the NHLPA’s proposals. But the NHL wants all three: league profitability, team profitability AND competitive balance. In order for the NHL and NHLPA to come to an agreement they will need to find a compromise on where this balance is struck.

What would healthy economics look like for a typical NHL team?

Now that we have looked at the overall league economics and the two ends of the financial spectrum between the Top 5 and Bottom 5 revenue teams, we really need to focus on the teams in the middle.

In portfolio management there are always ‘stars’ and ‘dogs’ but it is the fat middle of teams that really matter.  In fact, if you follow the GE/Jack Welch’s low-producing team mantra, the bottom teams are problems that need to be fixed by ownership/management and are not really an issue for the players to solve.

So now, let’s focus on the teams that represent the core of the National Hockey League, the 20 teams in the fat middle. We will refer to them as the “Middle 20”. If the “Middle 20” are not financially healthy given the economic business model that should be associated with a sports league like the NHL, then it makes sense to question the cost structure of the league.

As you can see, even though the salary cap is set at 57% across the entire league, for the ”Middle 20” teams are paying 63% of revenues in salary.  And with operating costs estimated to be $37.5 M by our analysis, the average “Middle 20” team is at best breaking even and more likely than not losing money.

So what should the cost structure look like?

Once again we will ignore the Top 5 and Bottom 5 teams and focus on the “Middle 20”. As discussed previously, it should not be unreasonable for these “Middle 20” teams to earn 8-12% operating income. Therefore, a sustainable cost structure could look like this (note this uses 2012 numbers and does not adjust for projected growth in 2012-13):

2011-12 “Middle 20” Economics to get to 8-12% Margins


We are not recommending any specific numbers, just showing a range on how the numbers could work to get to the 8-12% range.  If you take the median salary revenue share number of 51% for the “Middle 20” that would make a $49M salary cap hit for these teams. Currently the Top 5 teams spend ~8% more than the “Middle 20”. Assuming the top teams are at the salary cap ceiling, this would make the ceiling at $53M.  If you then extrapolate across the league, where you have 30 teams with an average salary cap hit of about $50M you get an effective revenue share rate of about 48.4%.  This overall number appears to be somewhat similar to the owners first proposal and may follow some of their rationale. Either way, it is clear the current 57% rate does not appear to be a reasonable rate.

As with any business, ownership must look across all economic levers (both costs and revenue) to improve profitability, so cost savings can clearly be found both in salaries and operating costs. Given that most of these costs are variable in the shorter term it is not unreasonable for  each cost center to contribute to finding some savings so that the burden is shared across all parties.


NHL Team by Team Economics

Now that we have looked at the general economics of the NHL as an entertainment /sports league compared to similarly structured industries, it is important to review the economics of individual teams (aka markets). Not all teams are created equal in the NHL portfolio and as a results there will always be ‘stars’ and ‘dogs’ and everything in between.

While the following data may or may not be exactly right, the over numbers do add up and certainly provide an excellent framing of the issues that are being discussed about big market vs.  small market teams. The following data is from ForbesCap Geek, our own analysis and leverages some additional operating cost details from the 2004 Levitt Report (adjusted for 2012 numbers).


Clearly there is a massive different between the Top 5 revenue teams are the Bottom 5 by basically a factor of more than 2:1 in aggregate.  This disproportionate sizing significantly affects smaller revenue teams since the salary cap is a factor of overall league revenues, so in effect as the big markets grow, the smaller markets must disproportionately spend a greater percent of their revenues on player salary just to remain competitive. The following table compares big difference in player salary as a percent or revenue at the two ends of the spectrum:

So what does this mean?  Large revenue teams have huge margins, but small revenue teams are going to struggle to break even because their operating costs need to be less than 33% of costs.

Based on our analysis and extrapolating data from the Levitt report, we estimate the average operating costs for a team is about $38.5M per year (and of course varies by team/market).  But at roughly those fixed costs, it is nearly impossible for small revenue teams to breakeven without changes to their cost structure.

This might be obvious to many people, but seeing the actual numbers and how many teams are affected by the overall average salary cap because of the disproportionate size of the Top 5 teams makes it a little more concrete how big the issue is.

How much profit should an NHL team make?

This is one of the fundamental questions at the heart of what is driving the NHL owners position as it relates to the CBA being negotiated. Now clearly any owner can decide they want to lose money with their team and spend money on anything they want in order ensure they aren’t profitable.  However, as mentioned in the previous post, the rational behavior is trying to balance the NHL owners’ conundrum which includes trying to maximize profit while trying to win a Stanley Cup.

So in order to examine what is a reasonable profit expectation for an NHL team one must first look at the business model of professional hockey. In particular the economics of what drives revenue, the cost structure of the league and how the economics compare to similar types of industries.

Professional hockey has an enviable revenue model; it has multiple stream of revenue and is not dependant on any single one. While the NHL receives a significant portion of revenue from ticket sales (much of which can be considered a subscription service since there is such a high season ticket renewal  rate by most teams), they all so receive television (a function of advertising, cable subscriptions) revenue, licensing and on-site revenues (parking, concessions etc.).  This many revenue streams for a single product is the envy of many entertainment and media related properties. Clearly revenue is a function of overall popularity of hockey as a sport, individual team success and appeal of individual star players along with other lesser factors. Given the growth of the NHL over the last seven years, revenue growth has not been a significant issue.

The NHL is in the entertainment business.  It has more of a cost structure associated with a fixed cost to put a team on the ice.  The primary costs are of course player salaries, arena costs and team operations. Additional details of the NHL costs can be found in the Levitt Report.  Now the most important element in the economic model of the NHL is to understand that the incremental (marginal) cost of selling another ticket or having another TV viewer is negligible and is essentially zero. This is very similar to selling another movie ticket or another copy of Microsoft Office.  Similarly, the cost of delivering the ‘content’ (movie production costs, software development costs or player salaries) must be managed to an overall Profit and Loss (P&L) statement.  These costs are essentially budgeted (or ‘fixed’ for a set period of time) in order to ensure they align with the overall P&L.

So why does this matter? Well it matters for two reasons. First, because that means in order to make a profit, rational NHL owners should be managing their player costs in relation to their revenue on an annual basis (the budgeting period for hockey). Secondly, given the type of economic structure of the NHL there is no reason that NHL teams shouldn’t be able to generate profits similar to other companies in industries that would be considered ‘peer groups’.  In the Fortune 500 there are three such industries: Entertainment, Internet Services and Computer Software.  Each of them has some significant fixed development costs in order deliver their offering, but low/negligible marginal costs. Specific companies include Disney, eBay and Symantec. While the economics of each industry and company are unique, it is not unreasonable to see profit margins anywhere from 8-20+%.  Similarly, the economics for any one team will vary great across the league based on market and team dynamics (i.e. there will be a portfolio of over-performing teams and under-performing ones), but in general for the typical NHL team it should very reasonable to expect to generate 8-12% operating income.

The NHL Owners Conundrum

In business, the challenge for every CEO of an established company is trying to balance the needs of three stakeholders:  Customers, Employees and Shareholders.  Each stakeholder is competing for more of what the company has to offer, whether it is a lower price (customer), higher wages (employees) or better earnings (shareholders).  A CEOs job is to continually make tradeoffs between these parties and strike the balance needed to keep the company healthy and growing.

In hockey, NHL owners are also trying to find the balance between three (somewhat) competing forces which at times seem contradictory.  The first two are pretty clear, which is 1) to make a profit and 2) to win a Stanley Cup.  However, each item does not exist in a vacuum. They belong to bigger eco-system which is the National Hockey League, and collectively the league is bigger than any individual team, and what is best for the league is a level playing field which gives each team the option of competing equally with other teams. So the third factor NHL owners try to manage overall is 3) Competitive balance.  Thanks to the salary cap initiated in 2005, the league has successfully seen a lot more parity than ever before with different teams winning the Stanley Cup and so many teams competing for a playoff spot up until then end of the season.

In upcoming posts we will explore how striking the balance of these three factors is very challenging for NHL owners under the current (expired) CBA because they must optimize for one or two at the expense of the third.  In particular, for many teams in order to remain competitive and take a serious run at a Stanley Cup it will be at the expense of profitability.  It is important to dive into the economic structure of individual teams in order to fully appreciate what makes striking this balance such a conundrum for owners.

NHL CBA – The economics of long-term contracts

When I first heard about the owners initial CBA proposal to the NHLPA, my first reactions were surprise, disappointment and ‘not cool’.  This may have been the owners initial negotiating point from which they would move back towards numbers similar to the CBAs negotiated in other leagues, but without additional context it reflects poorly on the NHL.  Such an extreme proposal requires explanation to justify their position.

I had not planned to address the new CBA with Puckonomics, but now that the negotiations look to be challenging right from the start I think there are at least a couple of topics that directly match what Puckonomics is all about. There are several economic and financial attributes which directly relate to why the owners are asking for certain terms in the latest bargaining session.

One of the most important pieces of the CBA puzzle is what percentage of revenue sharing should the players receive? I will save that analysis for my next posting.  First, I would like to discuss the owners initial proposal to limit free agent contract lengths to 5 years.

Let’s start with basics contract value and term.  The theory behind any multi-year contract is that the player will deliver about equal value via their performance to the future cash flows received from their contract.   The challenge is that as the contract length goes longer and longer the predictability of the player performance and thus the value they deliver becomes less certain. There is significant risk inherent in these long term contracts to the teams.  Because NHL contracts are guaranteed all the risk is borne by the teams and not the player.  Taking injuries out of the equation (which can be partially addressed via insurance) this creates an asymmetric model where players do not have a financial incentive to perform. Of course there are many other incentives a professional hockey player has to perform, but this lack of alignment is a real concern.

A counter-argument is that if the owners want to give out these long term contracts at their own will, as they have in recent weeks, that is their choice if they want to take on that risk.  However, what we have seen is an arms-race type of situation based on the current CBA as teams compete for elite talent, and the only way to secure their services is to offer long term contracts. Reasonable length contracts are no longer an option.

At Puckonomics we want to see the NHL be an efficient market, where player compensation is as close to the value they create as possible. We don’t side with either the players or the owners. So when a situation like contract length arises we just want to provide an economic perspective on how to deal with specific situation.

That being said, long-term guaranteed contracts remove efficiency from the NHL market.  Other leagues like the NFL do not have many guaranteed contracts.  If the NHLPA does not want to accept non-guaranteed contracts or some hybrid thereof, from an economic view, limiting the length of contracts to a more reasonable, predictable time period to reflect the true value of a player may be in order.  We do not know if it should be 5 years or 7 years or whatever (a further analysis on performance by elite players over several years would be required), but limiting the length of contracts to some single digit number does not sound unreasonable from an ‘economics’ perspective.

Shaone Morrisonn – Should be playing in the NHL

Shaone Morrisonn was signed to a two-year contract with the Buffalo Sabres for the 2011-12 season after spending several years with the Washington Capitals.  Unfortunately, Morrisonn spent the 2011-12 season playing for the Buffalo Sabres AHL affiliate Rochester Americans.  At the end of training camp the Sabres put Morrisonn on waivers with the explanation that he was being sent down for salary cap reasons. The Sabres were right up against the salary cap and the team could use the space to bring in a lower cost stay-at-home defenseman.  However, when you look a little deeper at the Morrisonn’s True Value there seems to be a disconnect.

Shaone Morrisonn
GP G A Pts TOI Cap Hit ($M) True Value ($M)
2008 76 1 9 10 20.3 0.90 1.74
2009 72 3 10 13 18.0 1.98 1.95
2010 68 1 11 12 17.6 1.98 1.86
2011 62 1 4 5 16.2 2.08 1.33
2012 AHL 2.08

Shaone Morrisonn’s numbers are remarkably consistent (especially when adjusting for injuries). He is essentially about a $2M per year player, and that is without factoring in his playoff experience with the Capitals.  Given his predictable output and value, one wonders if there is more to the story than the salary cap excuse for sending Morrisonn to the minors. On July 1 Morrisonn is once again a UFA, hopefully another team will recognize his past contributions and give him another shot in the NHL as a reliable, tough, stay-at-home defenseman.


Brad Stuart – What’s he worth?

Brad Stuart was traded from Detroit Red Wings to the San Jose Sharks this past weekend. Given the Sharks need for help on the penalty kill and a reliable, mobile defensemen it seems like he would be a good fit for a second tour with the Sharks. Since Brad Stuart makes his offseason home near San Jose and his family remains in the area during the season, it is nice to see that this could be a good match for both parties (I have seen his kids skating at Sharks Ice with their Stuart Red Wings jerseys on several occasions).

The Sharks have until July 1st to negotiate exclusively with Stuart. So the big question is how much is the 32 year old worth?

Looking at his performance the last five years shows the consitency of his game year in and year out. While he puts up a reasonable number of points he isn’t known for his offensive ability, but he does log over 20 minutes per game.

As you can see from the table below, Brad Stuart consistently rates at about a $3M value each year (when you adjust for injuries) but has been paid at $3.75 per year in this last contract with the Red Wings.

Brad Stuart
GP G A Pts TOI Cap Hit True Value
2008 72 6 17 23 21.2  $            3.50  $            2.31
2009 67 2 13 15 20.2  $            3.75  $             2.11
2010 82 4 16 20 23.2  $            3.75  $             3.00
2011 67 3 17 20 21.5  $            3.75  $             2.53
2012 81 6 15 21 21.1  $            3.75  $             3.00

In our analysis UFAs clearly receive contracts above their true value due to supply and demand issues and restrictions on entry level contracts.  Given Brad Stuart’s pending UFA status, his consistency year in and year out and tremendous experience of being in the Red Wings organization it would not be surprising if he once again signs for somewhere between $3.5M and $4M, with the amount varying on the term of the contract.  The Sharks probably want to sign Stuart for 2 years, and he would probably be asking for 3 or 4 years.  We shall see where the two sides net out.

Next up:  Zach Parise